Updated monitoring data from the EEA reveals persistent fine particulate hotspots in mid-sized European cities
There is no visible border between clean and polluted air. What ambient air quality monitoring makes legible — and what urban residents cannot see or smell with any consistency — is the accumulation of fine particles and nitrogen compounds that determine, over years and decades, the trajectory of respiratory and cardiovascular health across European populations. The European Environment Agency’s most recent assessments make for sobering reading: despite real progress over the past two decades, the gap between current air quality in many EU cities and the standards the World Health Organisation considers safe remains substantial.
The revised Ambient Air Quality Directive that entered into force in December 2024 moved EU legal thresholds meaningfully closer to WHO guidelines for the first time in sixteen years — a regulatory shift that will oblige most member states to accelerate action before the 2030 compliance deadline. But the updated rules also make explicit how far many cities still have to travel, and they reframe which urban environments face the steepest climb.

PM2.5 and NO2: The Two Pollutants Driving Health Concern
Air pollution is not a single phenomenon. It encompasses a range of compounds with different sources, behaviours in the atmosphere, and health mechanisms. For public health purposes, two pollutants have attracted the greatest regulatory attention in Europe: fine particulate matter (PM2.5) and nitrogen dioxide (NO2).
PM2.5 refers to particles with an aerodynamic diameter of 2.5 micrometres or less — small enough to penetrate beyond the upper respiratory tract, deposit in lung alveoli, and in some cases cross into the bloodstream. Sources include road transport exhaust, residential solid fuel combustion, industrial processes, and secondary formation from chemical reactions in the atmosphere. The EEA’s interim 2024 data estimated that over 90 percent of the EU’s urban population lives in areas where annual PM2.5 concentrations exceed the WHO annual guideline of 5 micrograms per cubic metre, even as the proportion exceeding the new EU 2030 limit of 10 micrograms is considerably lower.
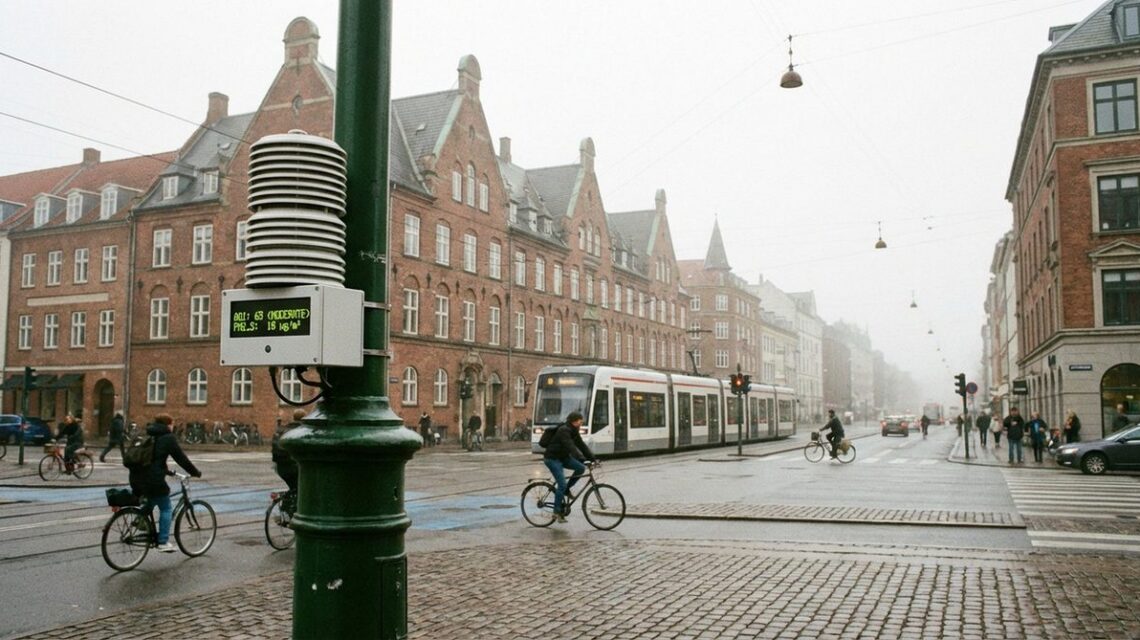
NO2 is primarily a marker of combustion processes — road transport in particular, which emits nitrogen oxides at street level in densely populated areas. The EEA’s 2024 monitoring data showed that exceedances of the current EU annual NO2 limit value of 40 micrograms per cubic metre remain concentrated at traffic monitoring stations, with Belgium, Italy, and Poland among the member states reporting limit value exceedances in specific urban zones. The revised directive tightens the annual NO2 limit to 20 micrograms per cubic metre by 2030, a target that will require decisive action in high-traffic urban corridors across multiple countries.
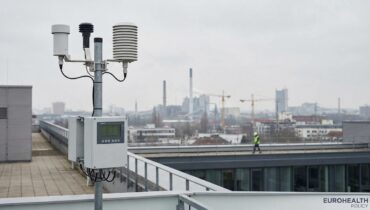
The EEA tracks both pollutants through its Air Quality Index, a composite indicator that synthesises monitoring data from thousands of stations across its member and cooperating countries. The index provides real-time and annual aggregated information, and its data underpins the Commission’s regular Zero Pollution Monitoring and Outlook reporting — including progress tracking against the EU’s Zero Pollution Action Plan.
The WHO Guideline Gap
In September 2021, the WHO published a comprehensive revision of its global air quality guidelines — the first major update since 2005. The new annual PM2.5 guideline was set at 5 micrograms per cubic metre, half the 2005 level of 10 micrograms and five times more stringent than the EU’s pre-2024 limit of 25 micrograms. The revision reflected a substantial accumulation of epidemiological evidence over the intervening sixteen years, particularly studies demonstrating health effects at lower concentrations than previously established.
The WHO guidelines are not legally binding. They represent the organisation’s best assessment of the concentration levels below which risks to human health become negligible or minimal. The EU’s regulatory framework sets its own limits through the legislative process, balancing scientific evidence with technical feasibility and economic considerations. This distinction has long been a source of tension in European environmental health policy: critics argue that the gap between WHO recommendations and legally enforceable EU limits leaves regulators able to claim compliance while populations remain exposed to demonstrably harmful concentrations.
The revised EU directive did not adopt the 2021 WHO guidelines in full. The new annual PM2.5 limit of 10 micrograms matches the WHO’s 2005 interim target, not the 2021 guideline of 5 micrograms. Environmental health groups have noted this alignment gap, though Commission officials have pointed to the 2030 review clause built into the directive, which requires further tightening if technical and scientific progress makes it feasible.
For practical purposes, what the WHO-EU divergence means is that a city recording an annual PM2.5 concentration of 8 micrograms per cubic metre — comfortably within the new EU 2030 limit — remains above the WHO guideline. Much of Western and Northern Europe currently sits in this range: legally compliant under both old and new EU frameworks, yet still carrying a residual health burden relative to what the scientific evidence suggests would be optimal.
The East-West Gradient
The most persistent structural feature of European air quality data is a geographic gradient running roughly from northwest to southeast. Cities in Scandinavia, the Iberian Peninsula, and the Atlantic fringe of Northern Europe record the lowest ambient PM2.5 concentrations. Moving across Central and Eastern Europe, concentrations rise — in some areas substantially.
The reasons are well-documented. In Poland, Czechia, Slovakia, and parts of Romania and Bulgaria, residential solid fuel combustion — coal and biomass used for domestic heating — is a major source of winter PM2.5. Unlike road transport, which the EU has regulated through successive Euro emission standards, domestic heating remains largely within national competence and has proven politically difficult to address through mandates. Poland’s national Clean Air Programme, launched in 2018, set targets for phasing out inefficient coal boilers, but progress in replacing the estimated four million non-compliant installations has been slow relative to the programme’s ambitions.
Vehicle fleet age compounds the picture for NO2. The average age of registered passenger cars in Poland exceeds 14 years; in Bulgaria, it is over 18 years — compared with a European average of under 12. Older petrol and diesel vehicles lack the emission control technology required under more recent Euro standards, and their concentration in cities with already strained air quality creates a compounding effect that monitoring data registers clearly.
The EEA has documented NO2 exceedances in the Sofia and Warsaw agglomerations in particular, and both cities face European Commission infringement proceedings related to air quality standards — a factor that has accelerated, if not fully resolved, the introduction of low emission zones. In Sofia, a low emission zone restricting older vehicles from central urban areas entered a phased implementation that has drawn scrutiny over enforcement consistency. Warsaw’s approach has proceeded more incrementally, reflecting both political constraints and the technical challenge of monitoring compliance at scale.

Health Effects: Respiratory, Cardiovascular, and Beyond
The health literature on air pollution has grown substantially in both volume and methodological sophistication over the past two decades. What had been understood primarily as a respiratory hazard has been progressively recharacterised as a systemic one, with robust evidence now linking PM2.5 and NO2 exposure to cardiovascular disease, stroke, cognitive decline, and adverse birth outcomes.
The EEA estimated in its 2025 burden of disease report that approximately 253,000 people died prematurely from PM2.5 exposure across EU member states in 2021 — the most recent year for which comprehensive data were available in the agency’s 2024 report. Cardiovascular causes account for the largest share of these deaths: PM2.5 triggers systemic inflammation that, over years of chronic low-level exposure, accelerates the development of atherosclerosis and increases the risk of myocardial infarction and ischaemic stroke. This pathway, once considered uncertain, is now regarded as established in the mainstream epidemiological literature.
The respiratory burden is more immediately visible. Chronic obstructive pulmonary disease, asthma, and reduced lung function in children are all associated with ambient air pollution exposure in large-scale European cohort studies. The EEA’s exposure assessments consistently show that even in cities where PM2.5 concentrations are below EU legal limits, the residual health burden — measured against the WHO guideline — remains significant at the population level.
NO2 adds distinct mechanisms to this picture. As a respiratory irritant and pro-inflammatory agent, nitrogen dioxide reduces the lung’s defence against infection and has been linked to increased hospital admissions for respiratory illness during pollution episodes. During the COVID-19 pandemic, research groups including one publishing in Science of the Total Environment identified geographic overlap between high NO2 concentrations and elevated COVID-19 mortality rates in Northern Italian cities — a finding that generated considerable methodological debate but underscored the biological plausibility of interactions between air pollution and respiratory infection.
For children, the developmental dimension is particularly acute. Exposure to traffic-related air pollution during early childhood has been associated in multiple European birth cohorts with impaired lung development and, in recent years, with reduced cognitive test scores and behavioural outcomes. These findings have strengthened the case for protecting particularly sensitive populations — children, the elderly, and those with pre-existing cardiorespiratory conditions — through targeted urban air quality interventions.
Policy Responses: Low Emission Zones, Clean Air Dialogues, and What Comes Next
The policy toolkit available to European cities for improving air quality has expanded significantly since the mid-2000s, but implementation remains uneven and the evidence base for some interventions is still developing.
Low emission zones — geographic areas within which only vehicles meeting specific emission standards are permitted — are the most widely deployed urban air quality instrument in Europe. The European Low Emission Zone network tracked over 300 active LEZs across European cities as of 2024, with significant variation in scope, enforcement, and the pollutants targeted. London’s Ultra Low Emission Zone, which charges non-compliant vehicles a daily fee within a large central area, is among the most rigorously evaluated, with monitoring data showing measurable reductions in roadside NO2 concentrations since full implementation. Comparable data from continental European LEZs is more mixed, partly reflecting differences in zone boundaries, vehicle scope, and enforcement capacity.
The Commission has supported local action through its Clean Air Dialogues initiative, which convenes national governments and city authorities to share implementation experience and identify barriers to compliance. The dialogues have generated useful cross-country learning, particularly on the political management of LEZ introductions and the social equity dimensions of restricting older vehicles from urban centres — since those vehicles are disproportionately owned by lower-income households. This tension between public health goals and social equity has been the most consistent political friction point in LEZ policy across the EU.
The revised Ambient Air Quality Directive introduced new requirements for member states to develop air quality roadmaps in non-attainment zones — structured plans mapping out the measures and timelines through which compliance with the new 2030 limits will be achieved. These roadmaps will be subject to Commission review, and infringement proceedings can follow where implementation falls short. Whether this enforcement architecture proves more effective than its predecessors is a question that will be answered by the mid-2020s monitoring cycle.
The chemical contamination of water sources adds another dimension to the urban environment and health connection that extends beyond ambient air. But it is air quality that remains the dominant quantifiable driver of pollution-related premature mortality in Europe, and it is here that the data most clearly shows both the scale of progress achieved and the distance still to travel before the 2030 targets become anything more than aspirational.
What Monitoring Data Can and Cannot Tell Us
The EEA’s monitoring network is extensive, but it is not comprehensive. The distribution of fixed monitoring stations across European cities means that measured concentrations are not always representative of the exposures experienced by different population groups. Traffic stations, by design, record concentrations at the most polluted points in urban environments; background stations capture ambient levels that may be significantly lower. Translating station readings into population-weighted exposure estimates requires modelling that introduces its own uncertainties.
Interim 2024 spatial estimates from the EEA’s European Topic Centre on Human Health and the Environment have extended the resolution of air quality mapping using satellite data and dispersion modelling, providing annual average concentration grids at one-kilometre resolution across EEA member and cooperating countries. These tools improve on the station-based picture significantly, but they depend on model assumptions that require validation against ground-level measurements — and those measurements remain sparse in some of the regions where concentrations are highest.
The policy implication is straightforward even if the data is imperfect: the populations most exposed to elevated PM2.5 and NO2 are concentrated in areas where regulatory progress has been slowest, and where the gap between current air quality and both EU and WHO thresholds is widest. Closing that gap requires not only tighter legal standards but the implementation infrastructure, enforcement capacity, and financial resources to make compliance a practical reality rather than a regulatory commitment on paper.